A leading voyage benchmarking tool for comparing voyages across shipping lines
Esgian Shipping Analytics offers detailed voyage and emission data, enabling users to quickly understand market trends, calculate emissions and ETS costs for completed voyages, and generate reports.
- Product type
- B2BSaaS productAnalytical toolData visualization
- Capabilities
- UX strategyUX researchUX/UI DesignPrototypingUsability testingDesign System
- Design awards
- iF Design Award 2025
Business opportunity
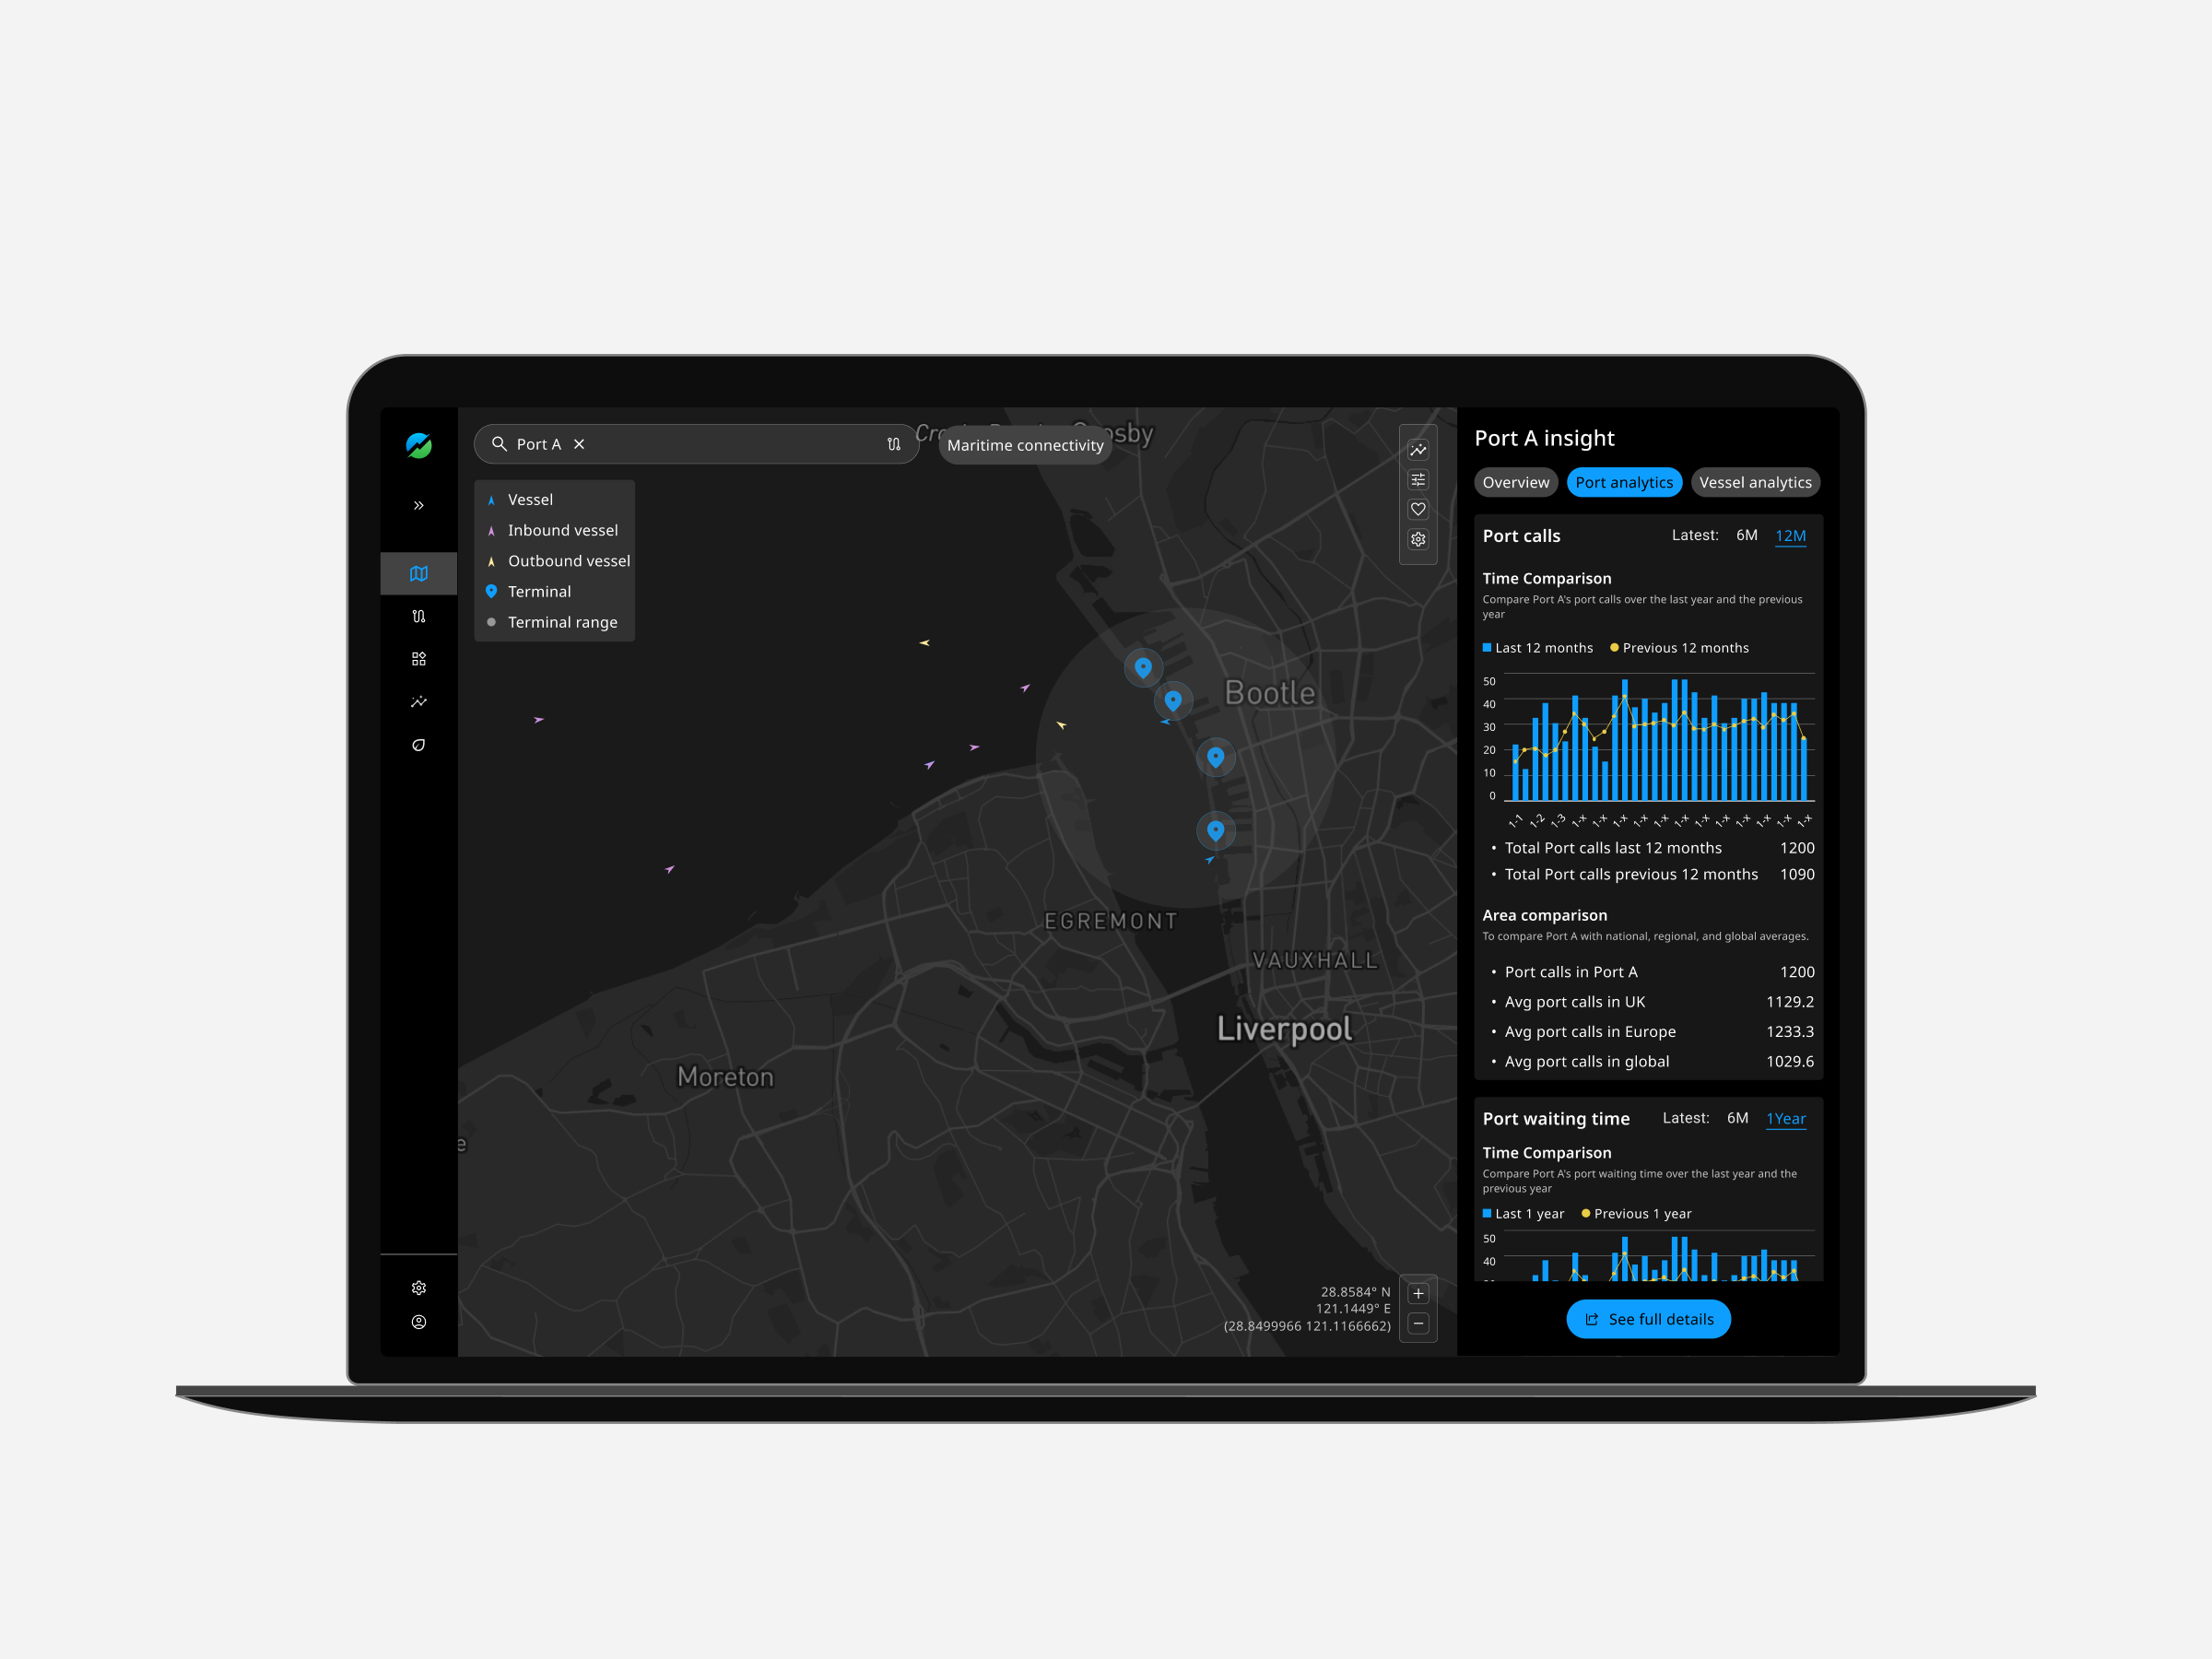
To reduce emissions, the EU has introduced the ETS policy for shipping. Industry stakeholders are now seeking tools and insights to optimize their fleets, cut emissions, and reduce ETS-related costs.
The Esgian shipping team focuses on a niche market, aiming to build a leading benchmarking tool for shipping clients. The tool provides actionable insights on voyages, emissions, and ETS costs for RoRo and MPP shipping.
Design challenge
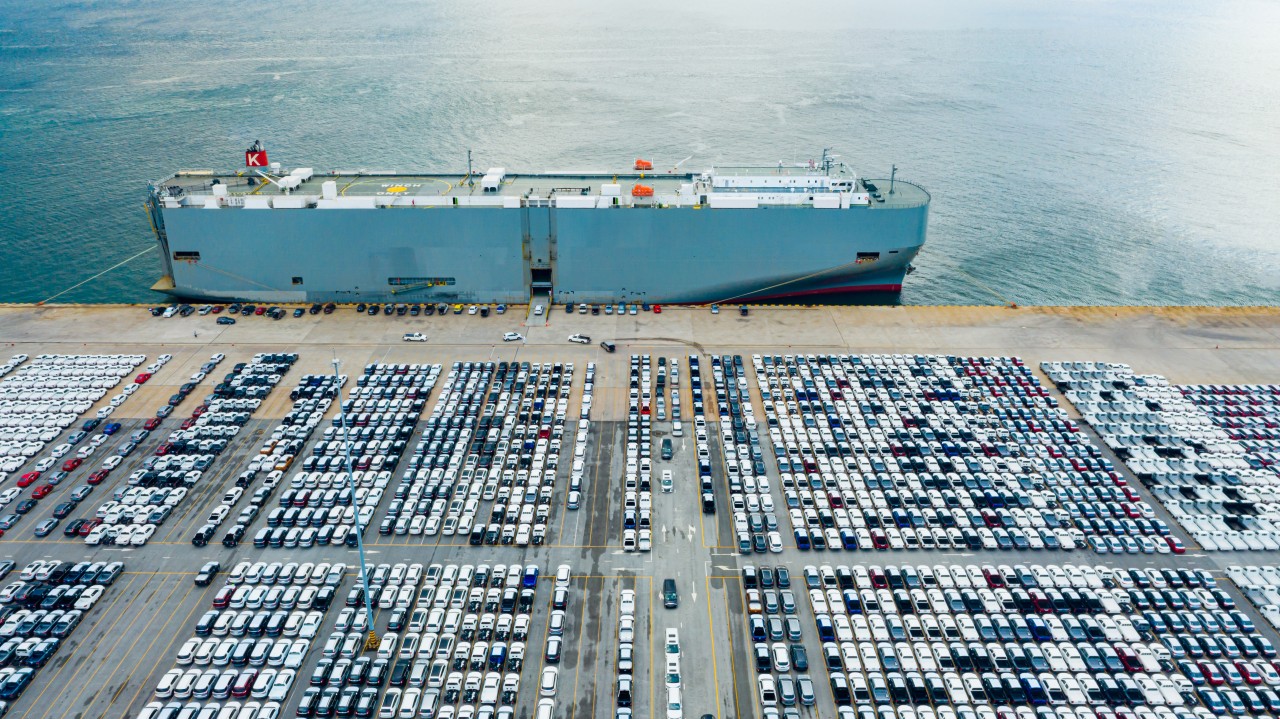
The task was to redesign the existing website and introduce new features. The structure of the current website could no longer accommodate the team's ever-expanding features and functionalities.
The design challenge was to propose a more scalable structure and clear navigation system, along with improved data visualization to effectively present complex information.
The information encompassed four main information assets: voyage, port, operator, and vessel. It aimed to provide relevant information to primary users including operators and cargo owners.
Approaches
The design process was intensive and rapid, including research, wireframing, prototyping, testing, and validation, both internally and through client meetings.
A key part of the approach was creating a scalable information structure for voyage, port, operator, and vessel data. The work focused on making complex shipping and emissions data easier to navigate, compare, and turn into actionable insight.
- Access real-time data and generate graphs or reports.
- Stay updated with the latest market trends.
- Compare horizontally and vertically to position themselves on the competitive map.
- Simulate parameters to explore the optimal solution.

Solution
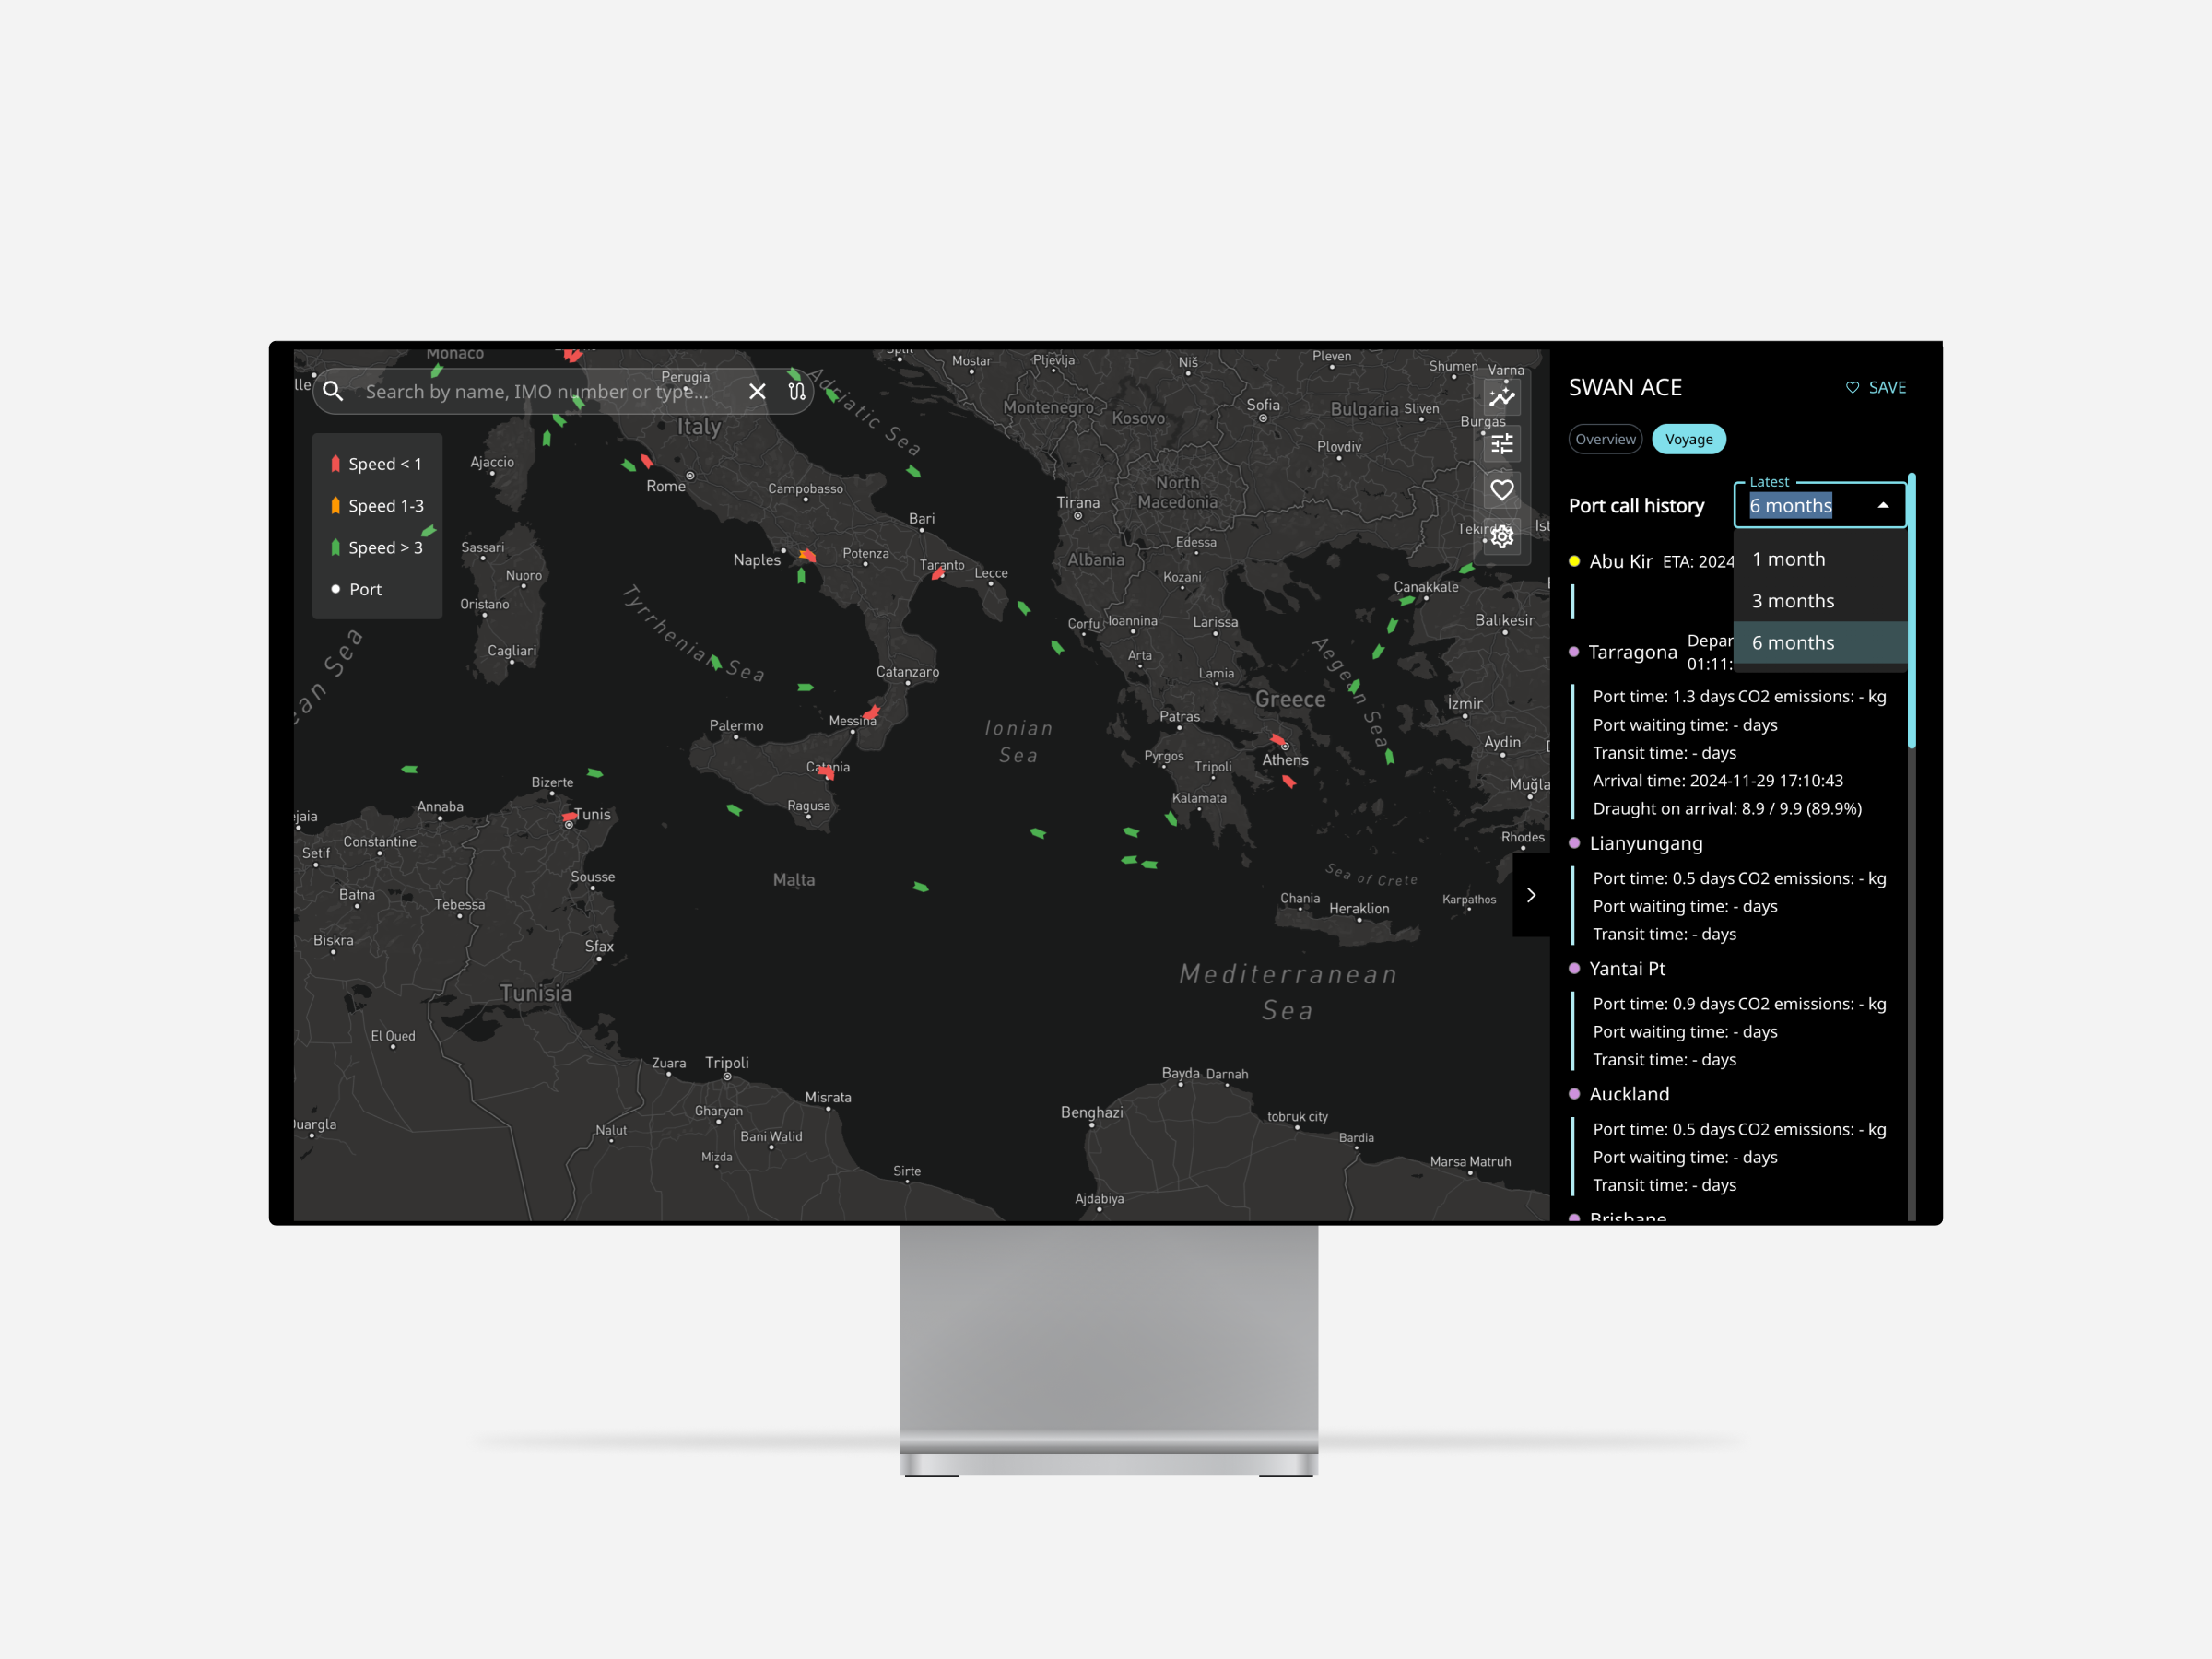
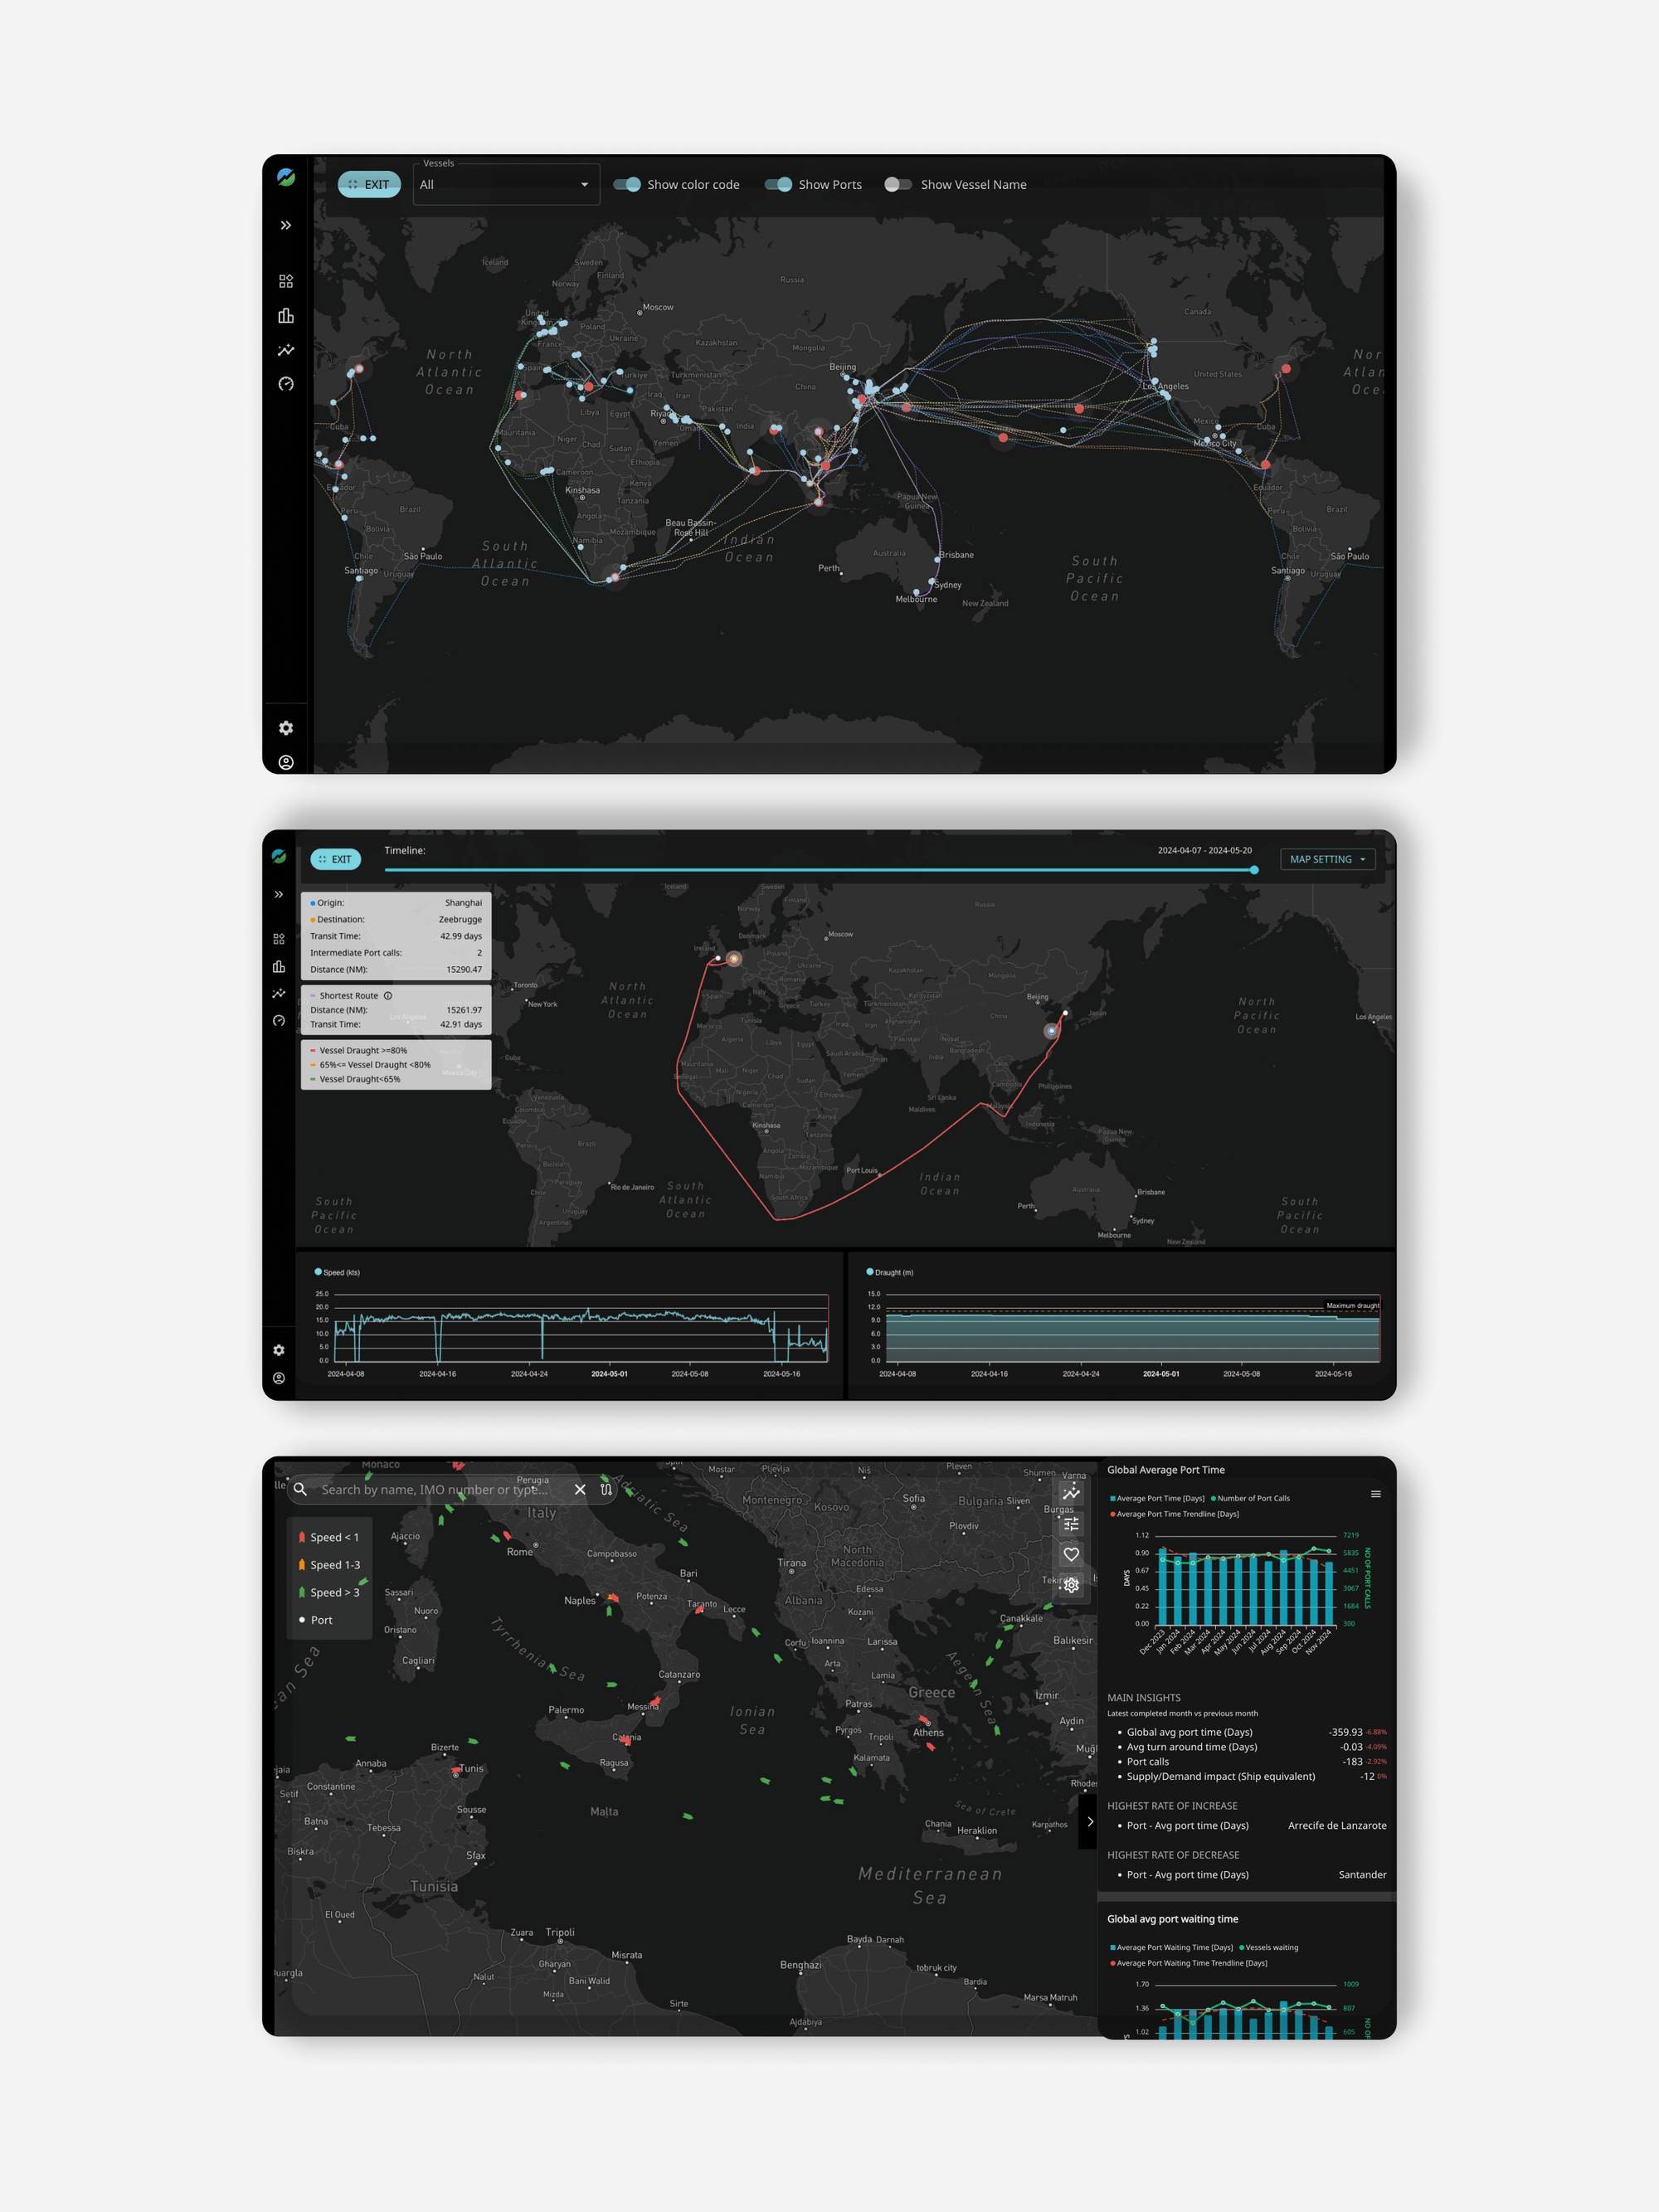
The final product direction introduced clearer navigation, improved data visualization, and reporting tools that support voyage benchmarking, emissions calculation, ETS cost analysis, and market comparison.
Results
The project received strong positive feedback internally. The design also received the prestigious iF Design Award 2025, recognizing its functionality, usability, and impact.